Aggregate raster layer to H3 grid
The code below uses the Toolbox SDK, which you can install with pip install toolbox-sdk.
Additional Python examples: using SDK, using Requests. If you prefer other programming language or need full API reference, check out Toolbox OpenAPI as well.
Docs
Creates an H3 grid covering the raster layer extent and aggregates raster values into its cells.
Inputs:
Input raster layer. GDAL-compatible raster dataset;
Minimal H3 Zoom (H3 zoom levels are valid in range 0-15);
Maximal H3 Zoom (H3 zoom levels are valid in range 0-15);
Band number - raster band to aggregate values from (leave empty to use band 1);
-
Pixel spatial handling mode:
PIXEL_CENTER (PIXEL_CENTER) - include pixels whose centers fall inside the H3 cell;
INTERSECTS (INTERSECTS) - include every pixel touched by the H3 cell;
-
Aggregation method. How to statistically aggregate values:
Create grid only (EMPTY)
Count (COUNT)
Sum (SUM)
Mean (MEAN)
Median (MEDIAN)
Min (MIN)
Max (MAX)
Mode (MODE)
Output field name;
Split zoom levels. If checked, each H3 zoom level cells will be saved in separate layer.
Outputs:
None
Example:
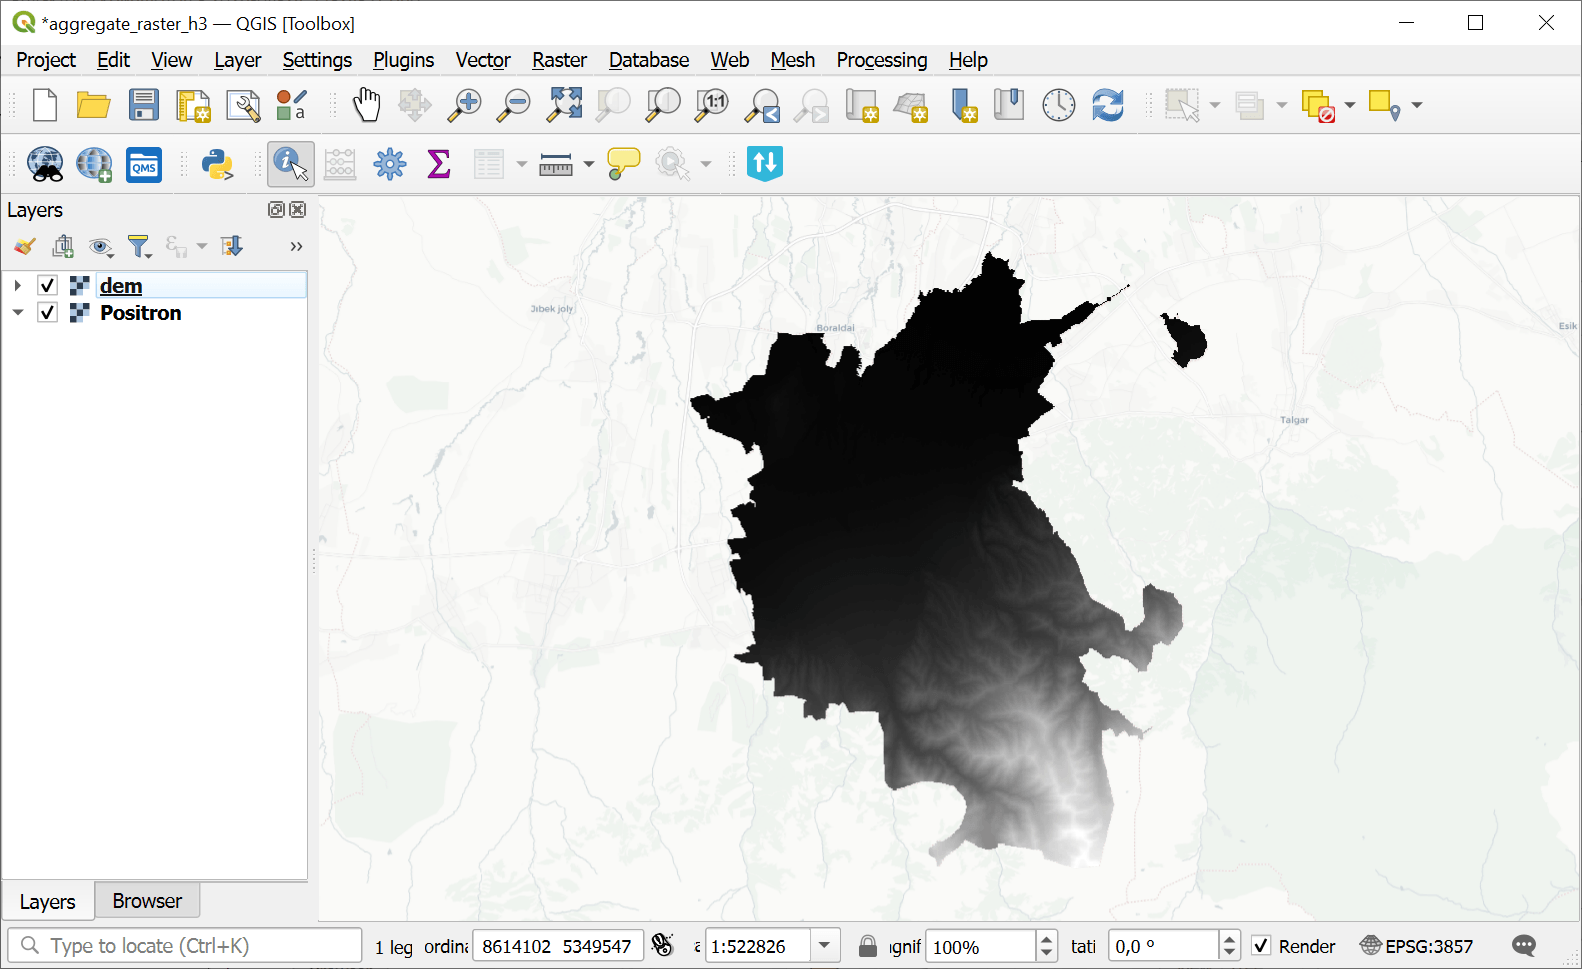
Example input raster layer: DEM
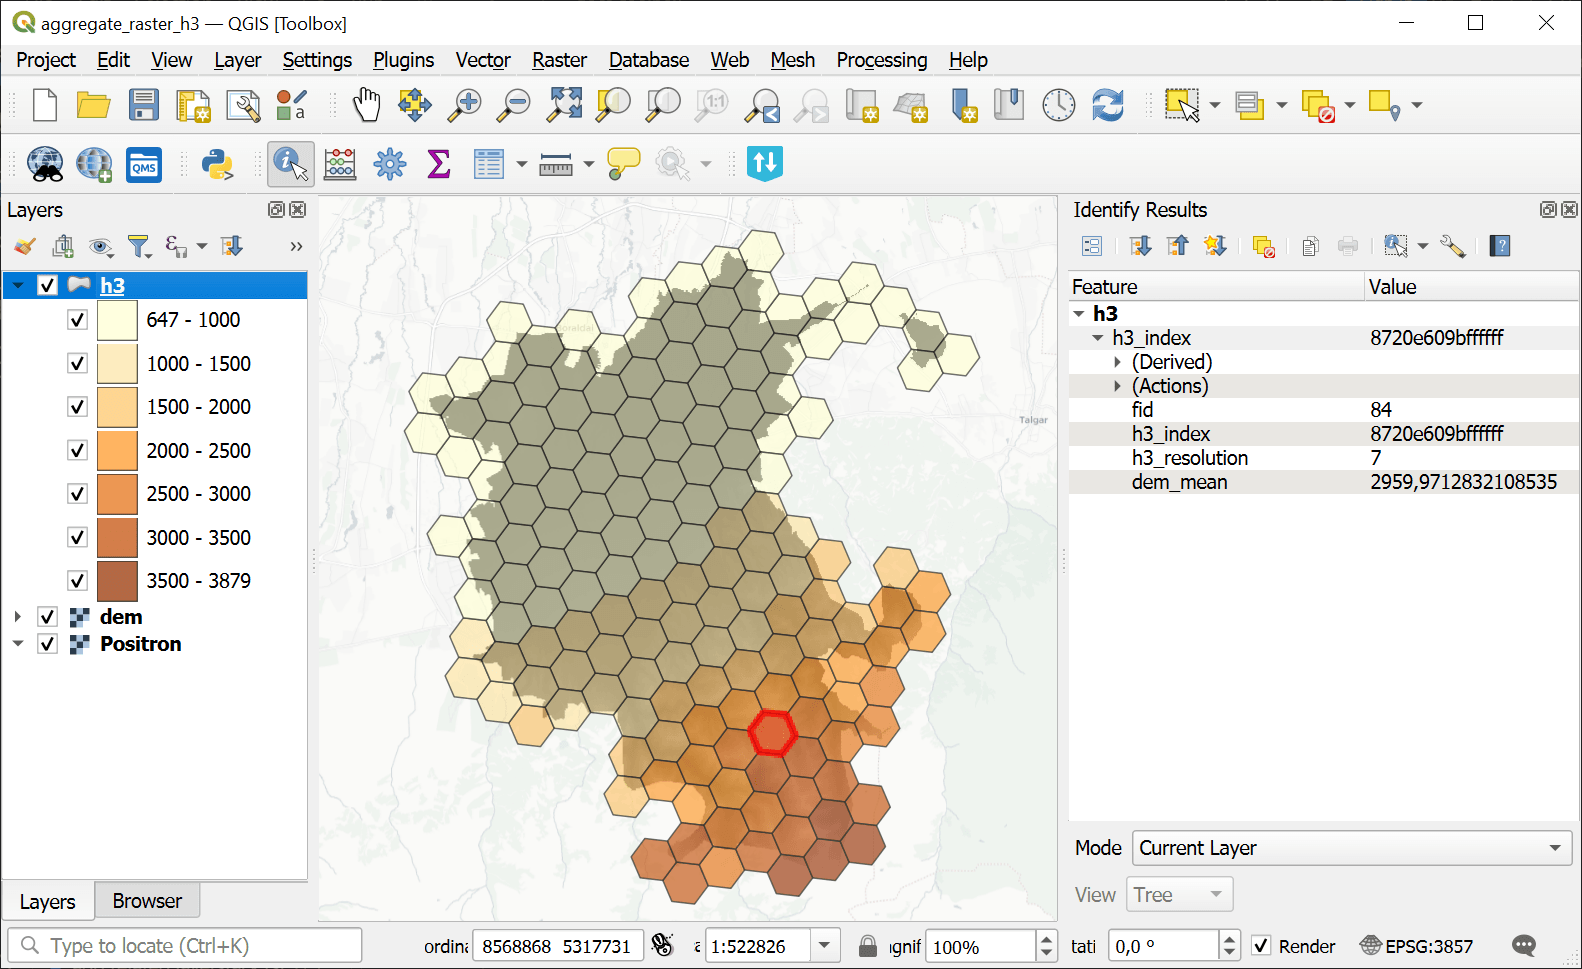
Example output H3 grid
Try the tool in action
Click on the Demo button above the tool form. The fields are filled in with demo values.
Click on the Run button.