Meter grid
The code below uses the Toolbox SDK, which you can install with pip install toolbox-sdk.
Additional Python examples: using SDK, using Requests. If you prefer other programming language or need full API reference, check out Toolbox OpenAPI as well.
Docs
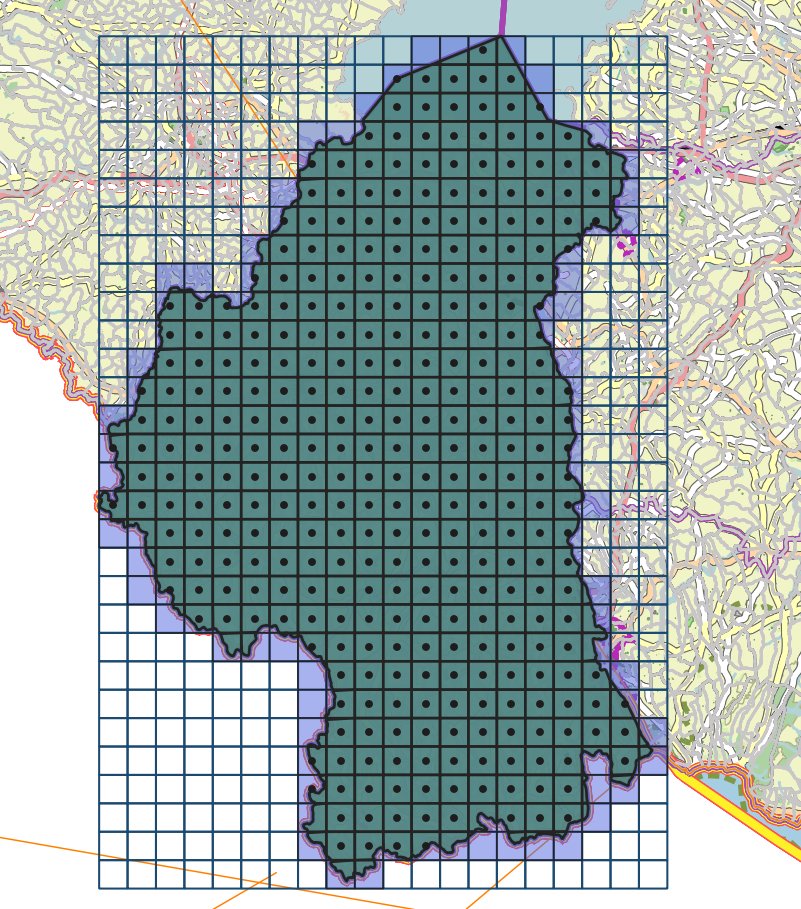
A combination of generated grids
The tool generates a grid within the boundaries of features of a vector layer or a bounding box. The grid size is set in meters. Features can be anywhere in the world.
Inputs:
Step. Grid cell size in meters;
Mode. Squares or points. Default: points;
Clip. How to clip the grid: 1) By feature boundaries, 2) Keeping all grid cells that intersect boundaries, 3) Keeping all grid cells in the extent;
Boundary polygon vector file in Geopackage format. Multipolygons are supported. Calculation time depends on the number of nodes in the boundary layer;
Extent. Set the extent on the map or upload as file;
Grid alignment. Mode of clipping edges of grid. 1) Vertical - the grid looks vertical in WGS 84 (EPSG:3857) projection, but angles and distances may be distorted.; 2) Precise - a grid with more precizely matching angles and distances, however it will look tilted in EPSG:3857.
Output:
GeoPackage containing the grid. Each cell/point of the grid has the following attributes: number (cells are numbered vertically, top to bottom, left to right, starting with the first left column even if it doesn’t reach the top), row_index and col_index. To display the numbers, enable lables in the layer style settings and select the desired attribute.
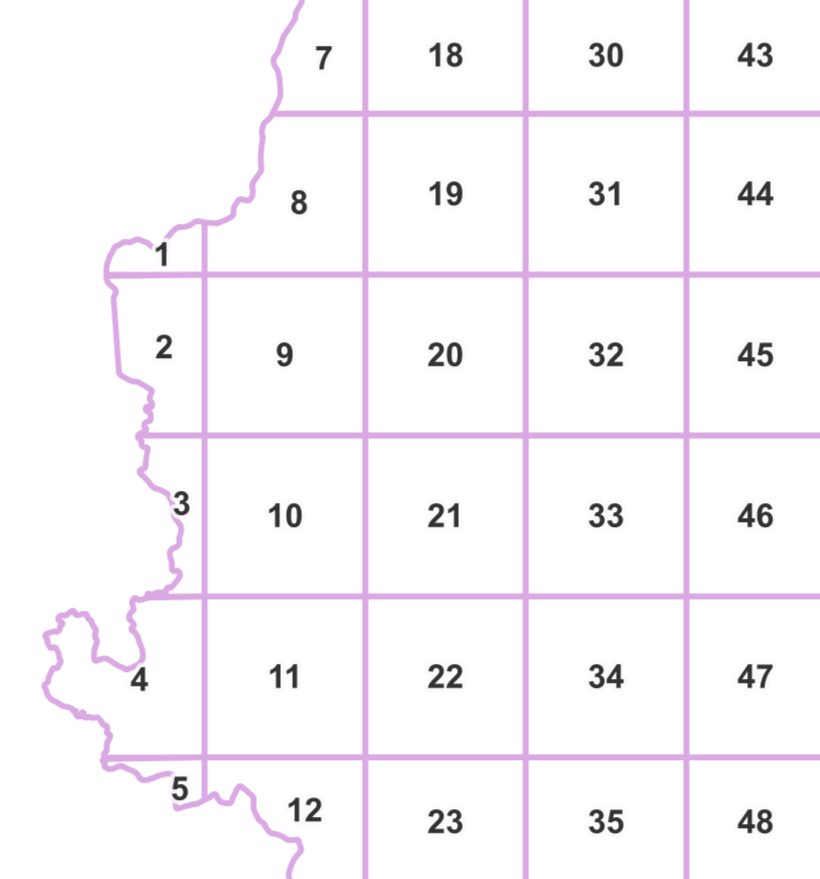
Cell numbers displayed
Resulting grids with different settings:
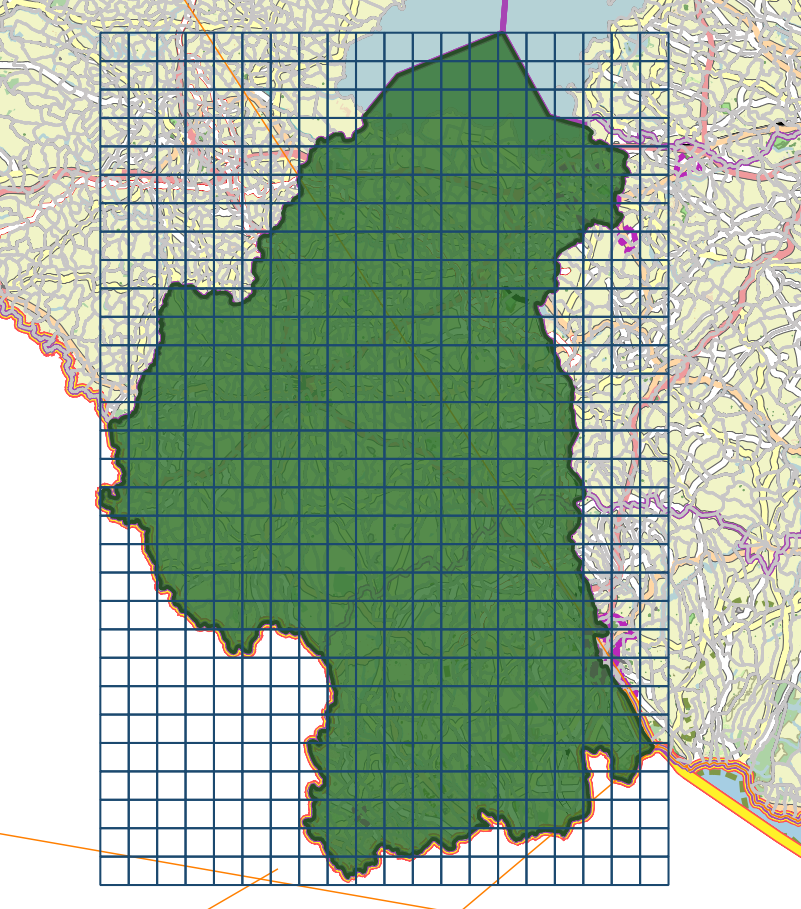
Squares - all
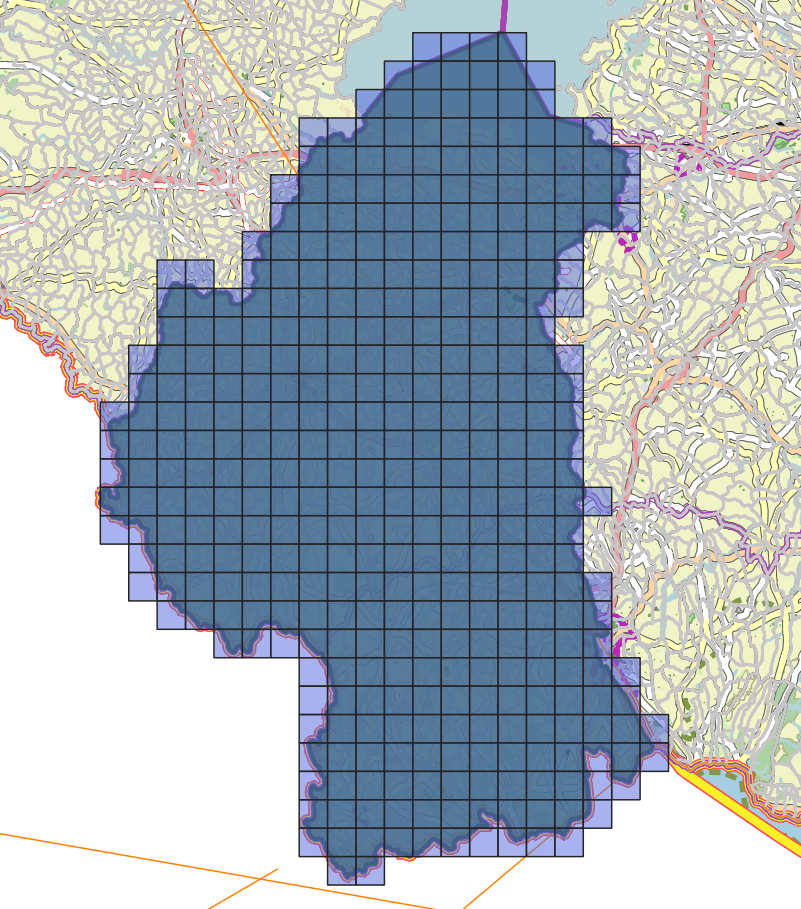
Squares - including all intersecting
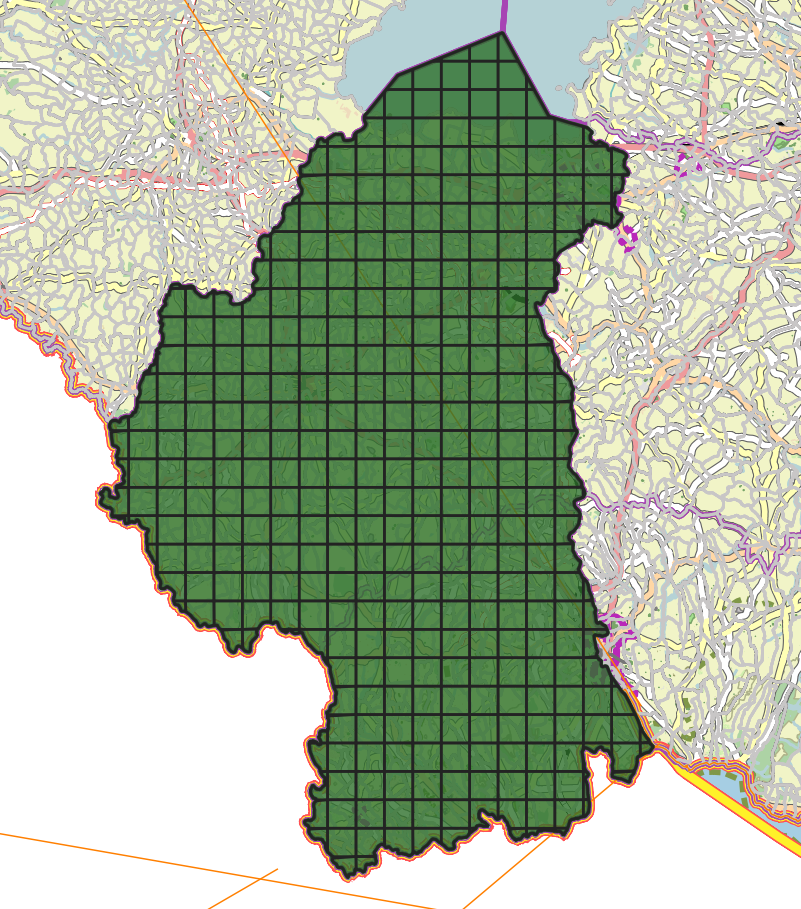
Squares - clipped by the boundary
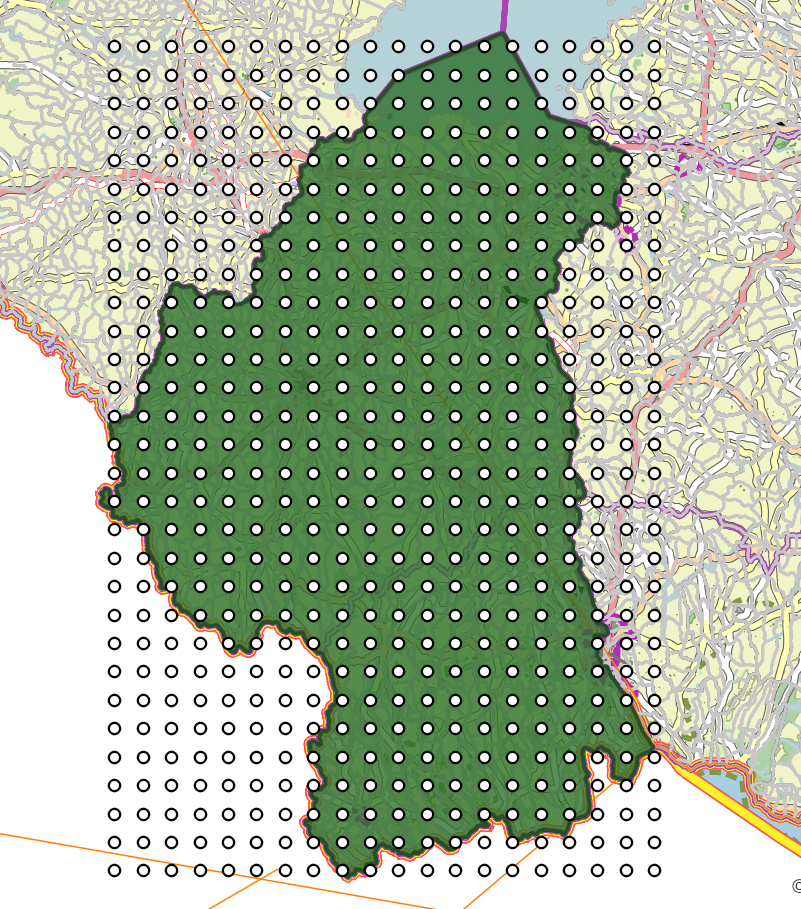
Points - all
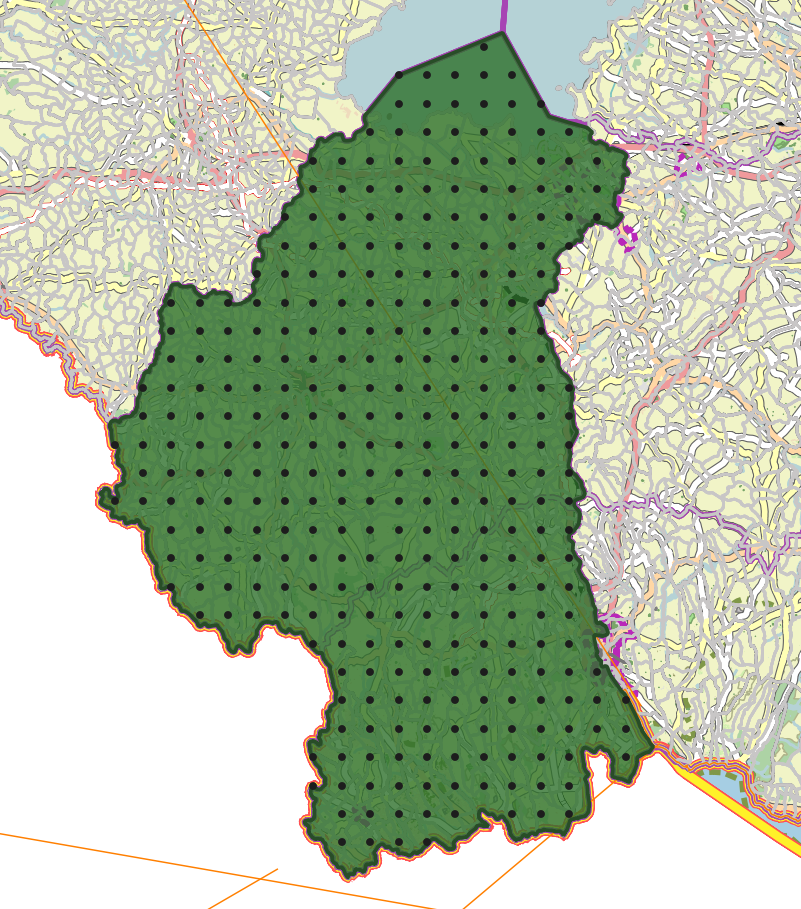
Points - clipped by the boundary
Try the tool in action
Click on the Demo button above the tool form. The fields are filled in with demo values.
Click on the Run button.