Aggregate vector layer to H3 grid
The code below uses the Toolbox SDK, which you can install with pip install toolbox-sdk.
Additional Python examples: using SDK, using Requests. If you prefer other programming language or need full API reference, check out Toolbox OpenAPI as well.
Docs
Creates an H3 grid covering the vector layer extent and aggregates vector features and attribute values into its cells.
Inputs:
Input vector layer. GDAL-compatible vector dataset;
Minimal H3 Zoom (H3 zoom levels are valid in range 0-15);
Maximal H3 Zoom (H3 zoom levels are valid in range 0-15);
Aggregation attribute - numeric attribute used for aggregation. Not required for grid creation, feature count or geometry sum;
-
Feature spatial handling mode, select one from the list:
Fully inside (FULLY_INSIDE) - include only features completely inside an H3 cell.
Intersects (INTERSECTS) - include every feature intersecting an H3 cell.
Split by H3 grid (SPLIT) - split line or polygon features by the H3 grid and distribute attribute values proportionally to fragment length or area where applicable;
Aggregation method. How to aggregate vector features or attribute values: - Create grid only (EMPTY) - Count features (COUNT) - Sum length or area (GEOMETRY_SUM) - Sum (SUM) - Mean (MEAN) - Median (MEDIAN) - Min (MIN) - Max (MAX)
Output field name - name of the output aggregation field. If empty,
aggregated_valueis used;Split zoom levels - if checked, cells of each H3 zoom level will be saved to a separate layer.
Outputs:
GeoPackage containing H3 grid.
Example:
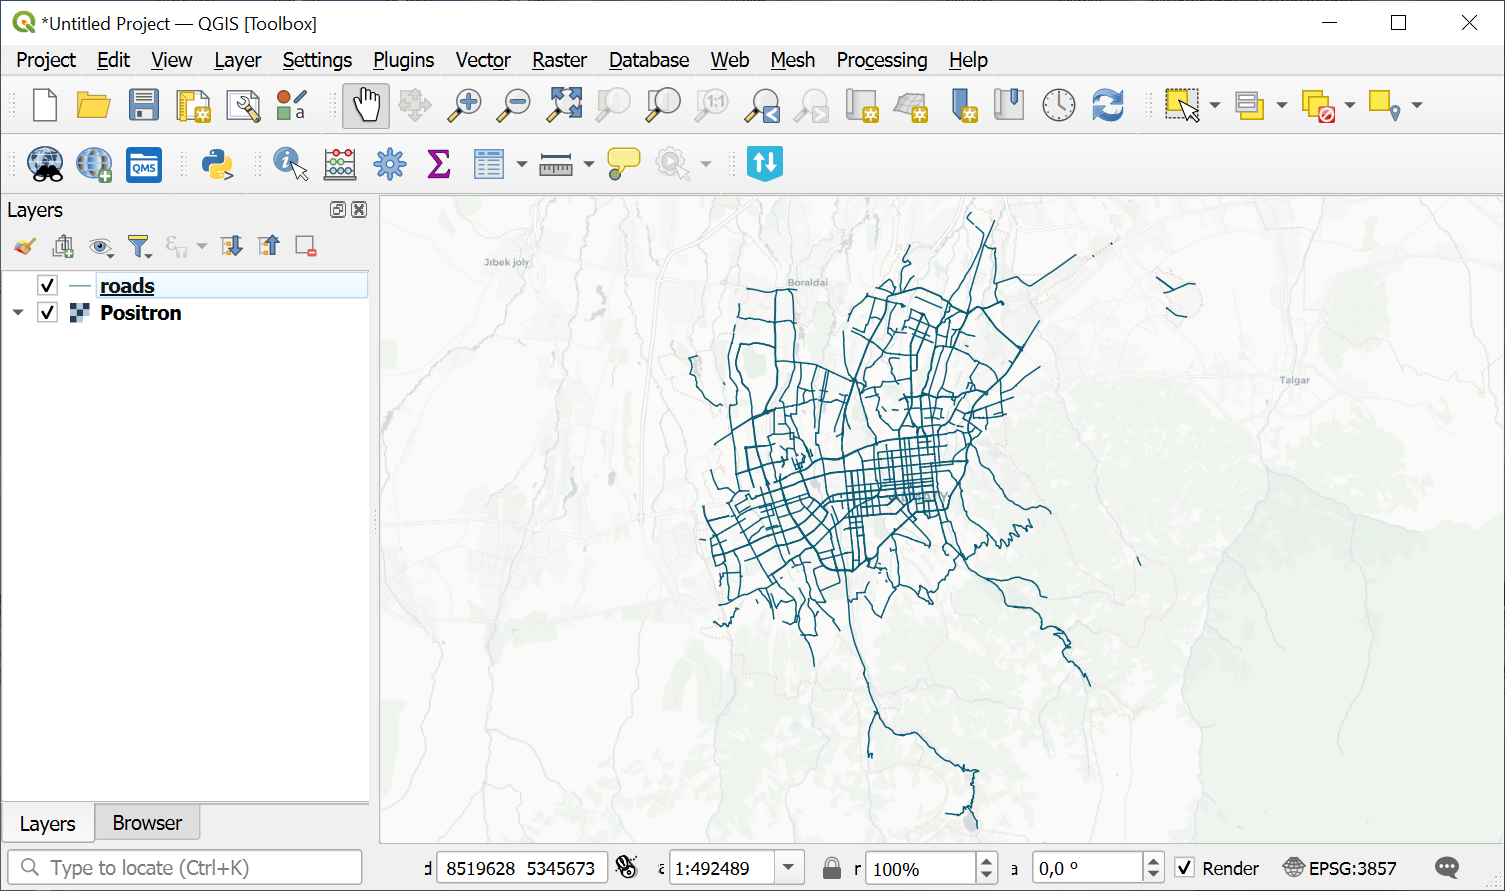
Example input vector layer
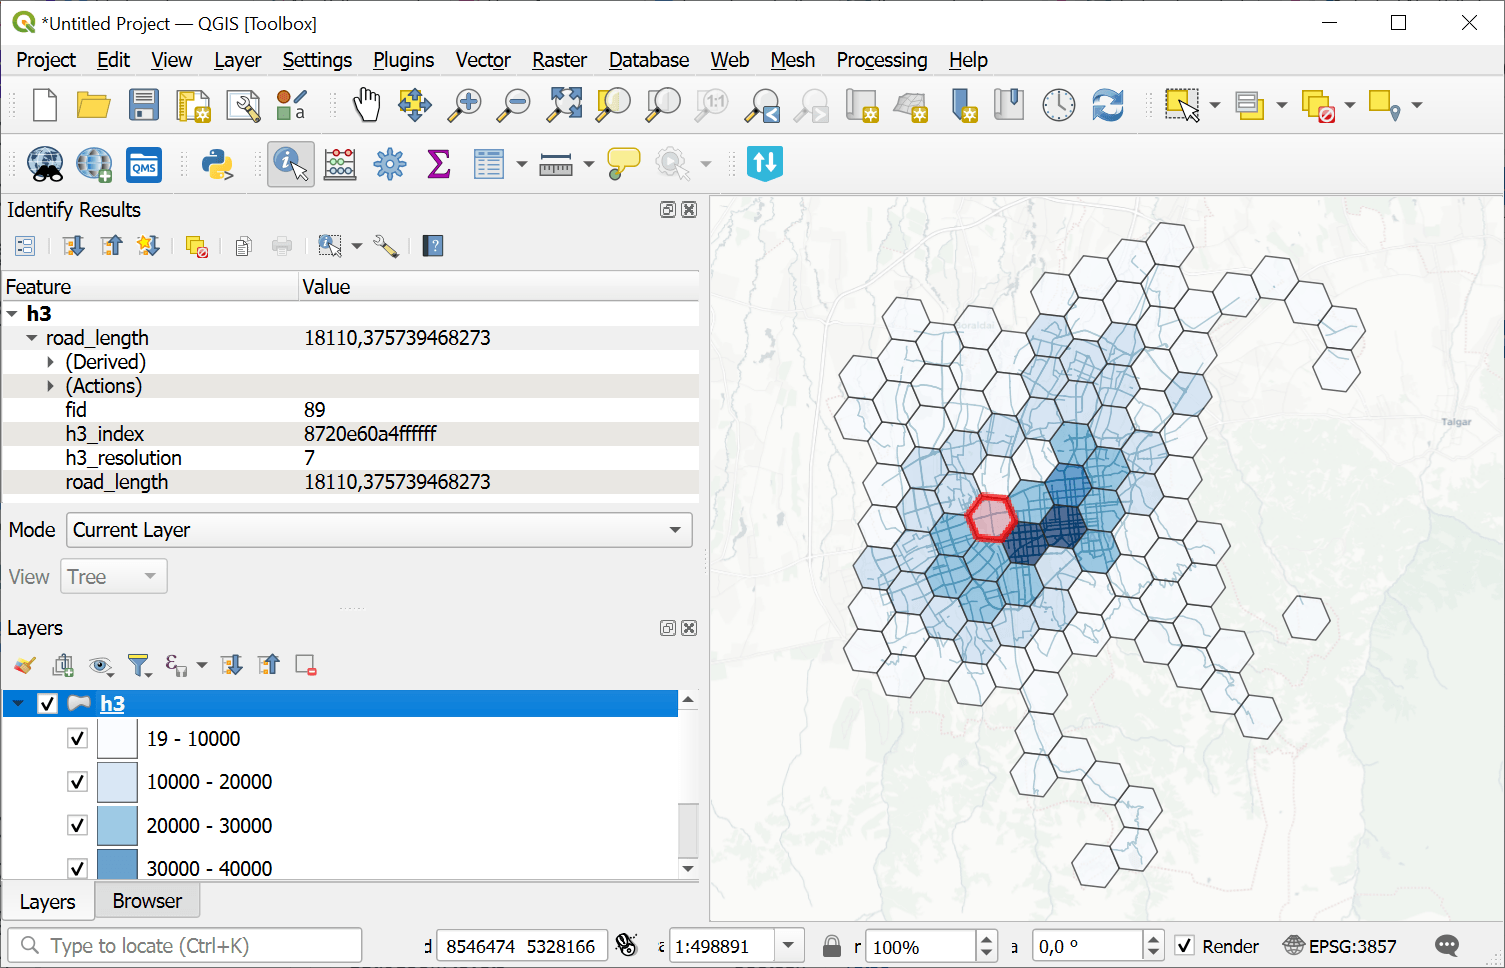
Example output H3 grid
Try the tool in action
Click on the Demo button above the tool form. The fields are filled in with demo values.
Click on the Run button.